
Clean energy.Clearer decisions.
A desktop dashboard for monitoring solar energy. Generation and consumption lead the story; system health and environmental impact add context.
- The challenge
- Make dense energy readings easier to prioritise at a glance.
- My contribution
- Information hierarchy, dashboard UI and data visualisation.
- Project status
- Interface exploration · Not yet validated with users.
A useful answer before another number.
Kilowatts. Capacity. Yield. Consumption. Every reading matters, but a page full of equally urgent numbers makes it hard to know where to look first.
The starting question was simpler: are we making more than we’re using? I used that question to organise the screen, moving from a system summary to current performance, then to the wider environmental picture.
Three layers, three questions.
The screen reads in three layers. Each answers a different question, so the detail has a place without competing with the overview.
Is the system healthy?
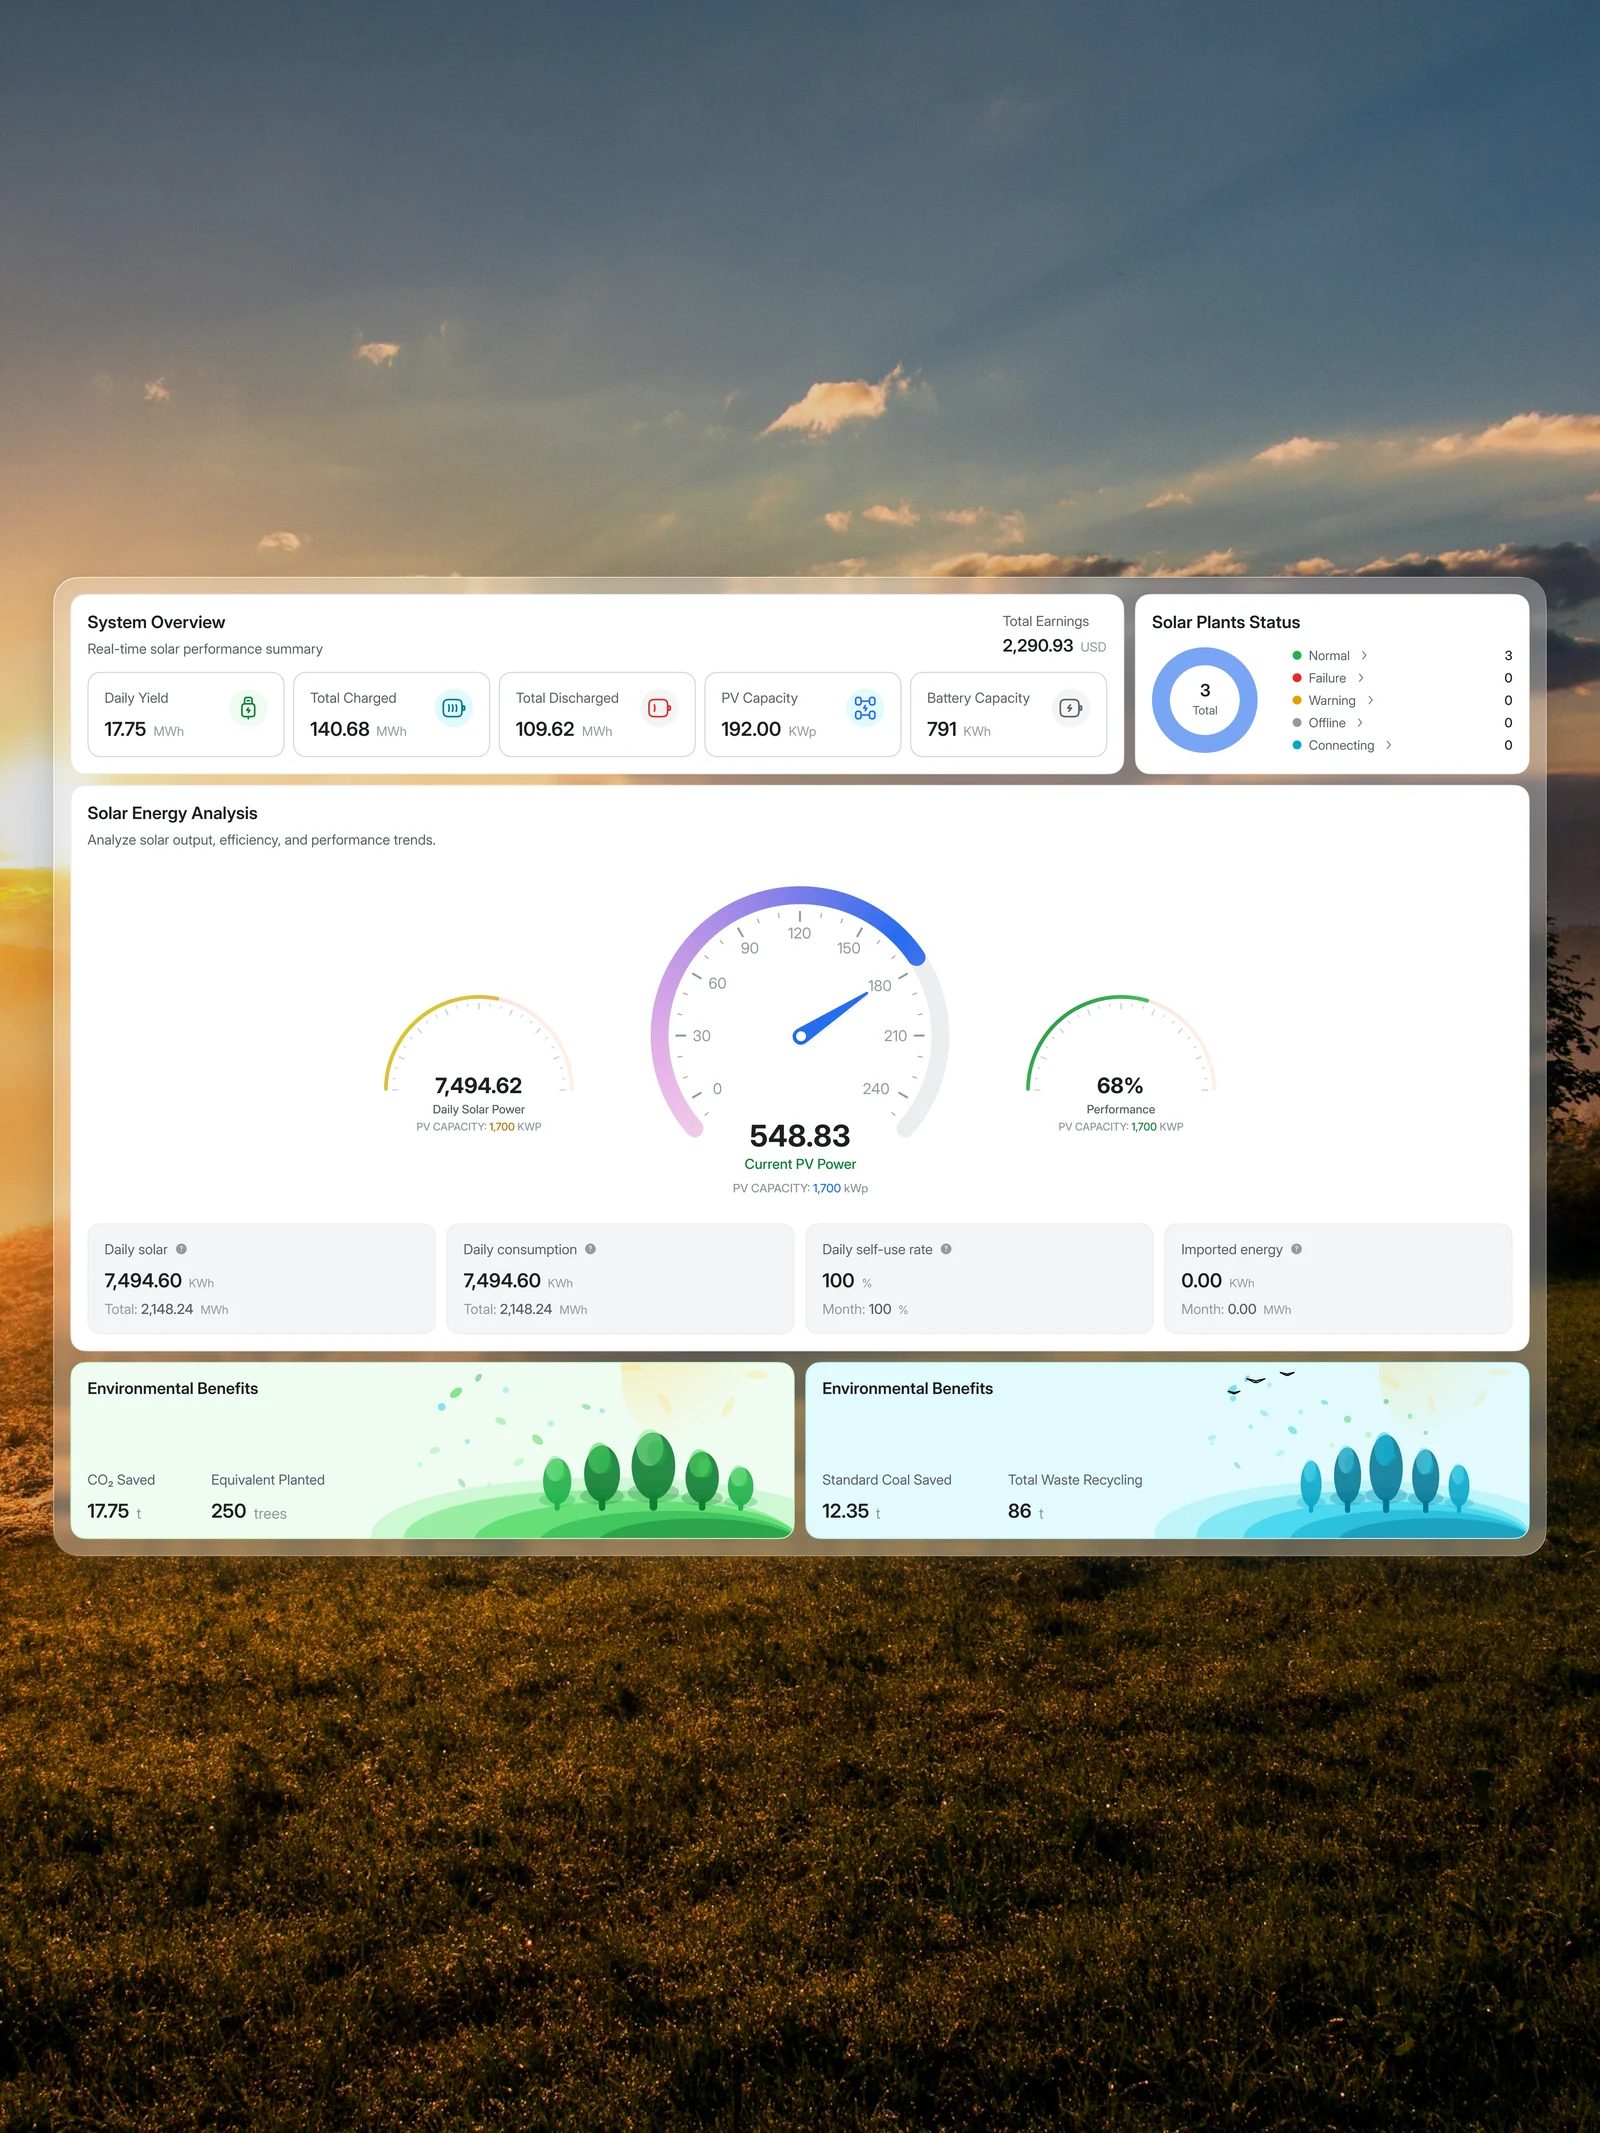
Yield, charging, discharge and capacity sit together at the top. Plant status lives alongside them, pairing colour with labels and counts so the signal isn’t carried by colour alone.
What’s happening right now?
Current PV power has the strongest visual presence. Daily solar power and performance flank it, while consumption, self-use and imported energy sit in a quieter supporting row.
What does that energy mean?
Environmental benefits translate the technical readings into familiar references: carbon saved, equivalent trees, coal saved and waste recycling. A gentler illustrated finish gives these numbers their own space.
A calmer surface for technical information.
Frosted white panels establish a consistent reading surface against the meadow. Neutral backgrounds hold the everyday readings; blues and greens bring attention to performance and environmental information.
Space does as much work as colour. Related numbers stay close, sections have room to breathe, and the larger gauges establish the visual hierarchy before the smaller details come into focus.
What this explores. What comes next.
The useful part of this exploration is the hierarchy: a screen that gives each kind of information a clear role, rather than asking every number to become the headline.
The next step would be testing that hierarchy with people monitoring energy systems: can they find an abnormal plant, compare generation with consumption, and explain the units without hesitation? Empty, delayed-data and alert states would need the same care before this became a working product.
Interface exploration. The energy readings shown are illustrative.